What is the Maritime Continent?
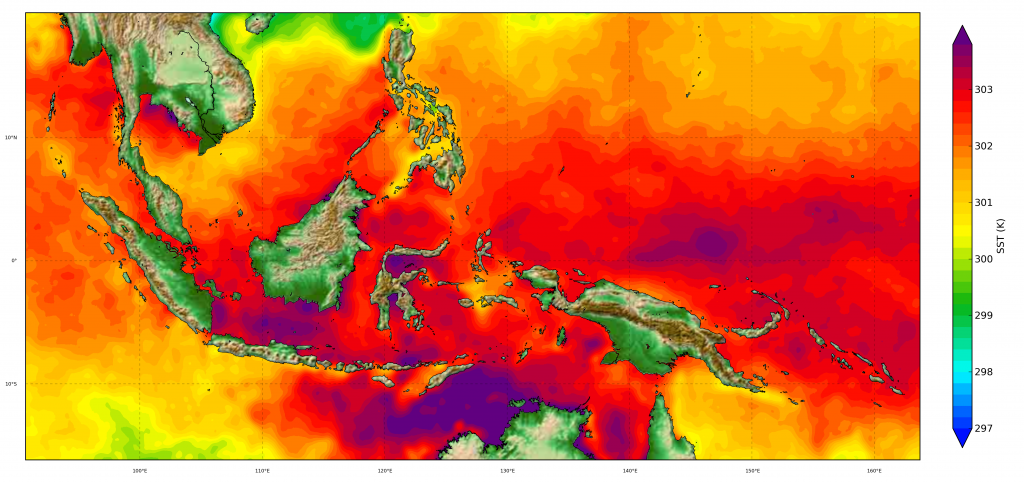
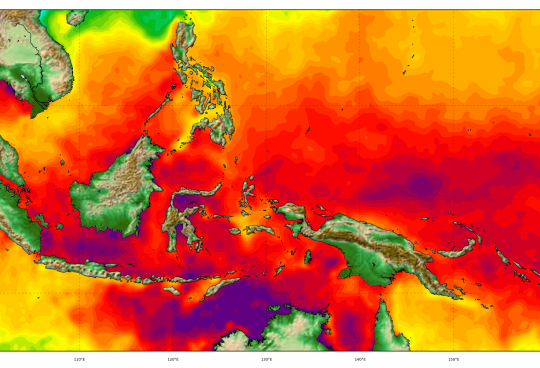
The Maritime Continent is the largest archipelago in the world and is formed by thousands of islands of varying sizes. Its located approximately between 15°S and 15°N, and between the Pacific and the Indian Oceans.
What is the role of the Maritime Continent in the Earth’s climate?
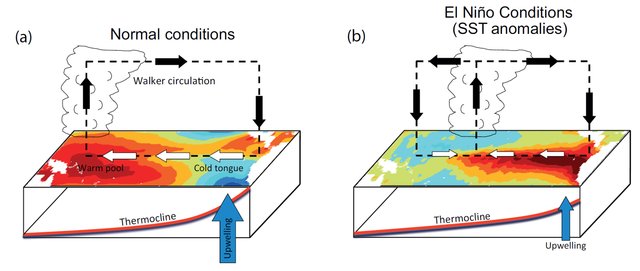
The Maritime Continent is interesting not only regionally due to its climatic and orographic peculiarities, but also globally because convection in the region has implications elsewhere. It is in fact a centre of very deep convection that injects moisture and energy in the upper levels of the atmosphere that is then redistributed in the planet. It is also part of the El Niño-Southern Oscillation (ENSO), one of the major sources of variability in the Earth’s climate, because it contributes to the ascending branch of the so-called Walker Circulation.
Rainfall and convection in the Maritime Continent
As mentioned above, convective circulations in the Maritime Continent are crucial for the region because it generates large amounts or rainfall characterised by features such as a marked diurnal cycle and a contrast between land and ocean. In other words, in the Maritime Continent it rains almost always at the same time of the day over the islands. A series of factors interplay to generate this pattern, but the most prominent ones are the land-sea thermal contrast and the topography.
Land warms faster than the ocean in the early morning and this difference generates local circulation known as sea breeze. It brings moist air from the surrounding ocean over land. In each of the islands, these air masses meet and rise up, which is further helped by steep mountains. This is what triggers convection and often produces rainfall in the afternoon.
Once the sun sets, land cools faster and the opposite occurs and air moves out of the island. In addition, disturbances produced by convection during the day over land propagate to the ocean and tend to generate rainfall at night and during the early morning, although not as regularly as over land.
This mechanism is relatively simple to understand, but represents a great challenge for most atmospheric models, which tend to produce rainfall to early over land as compared to reality. This is an evidence of deficiencies on how models represent convection at these scales.
Recently, scientists are investigating the use of very high-resolution models to better represent tropical convection and better understand the source of this mismatch in precipitation characteristics. At low resolutions, models do not properly represent convection, and they must be described with semi-empirical approximations called parameterisations. They help trigger and develop convection that would go unresolved otherwise. Models operating at higher resolution (< 4km) no longer need this parameterisation and we can expect them to represent convection explicitly. This is a conceptual step forward in modelling and brings some significant benefits, such as better representing the diurnal cycle of rainfall.
In our group, we have performed simulations at very high resolution (2-4 km) over the Maritime Continent to explore how they simulate convection. In the video below, we show the diurnal evolution of convection in the Maritime continent using these models. It is a section along latitude 5°S that spans most of the Maritime Continent and depicts the vertical structure of the atmosphere.
Here, we show a representation of convection in the Maritime Continent by the Weather Research and Forecasting Model v3.9.1. At the bottom (bar in blue gradient colorer) shows precipitation rates (0-1.0 mm hr-1). The black silhouette is the topography as seen by the model. In the vertical, we show the wind speed (arrows), relative humidity (contours), temperature (shaded contours), and cloud fraction (grey shades from 0 to 70%). Vertical winds speeds are multiplied by 20 so their scale is comparable to the horizontal one.
There are a few aspects that we explained above and are visible here:
- The propagation of precipitation in and out of the islands as the day progresses and the thermal contrast between the land and the ocean changes
- The onset of the sea-breeze in most inlands, when surface temperatures increases and the onshore winds intensify
- The generation of clouds over the mountains in the early afternoon, that dissipate in the late night early morning
- The vertical transport of moisture from the lower atmosphere to the tropopause and beyond by deep convection
Thus, these kind of models are a great tool to explore the mechanisms that generate rainfall in the Maritime Continent, as well as to improve our understanding of tropical convection. Advancing our ability to better represent tropical convection in models and simulate rainfall realistically in in the tropics is crucial for a breadth of applications such as weather forecasting or global climate projections.

Recent Comments